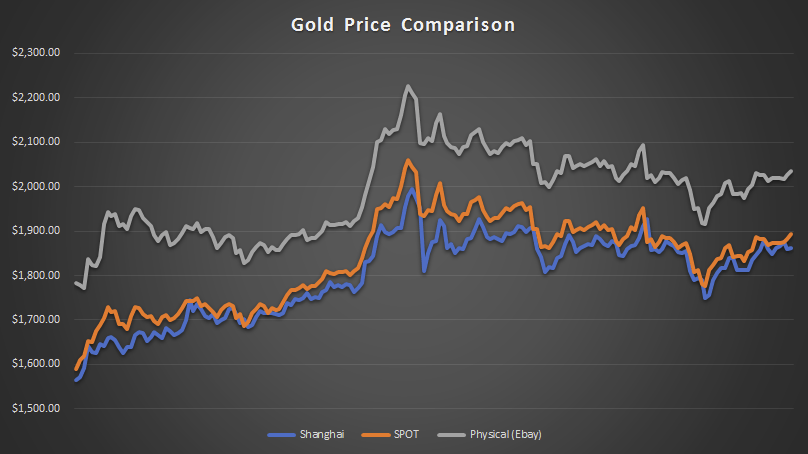
Graph start date is 4/1/20.
I decided to include this new page to my website so that visitors could see how the Shanghai price of gold compared to the SPOT and Physical Prices. From what I can tell, the Shanghai price has not varied very much from the SPOT price since I started keeping records on April 1, 2020. This suggests to me, again, that the system has not collapsed yet.
The Shanghai price is taken from Kitco and is an average of the AM and PM prices.
The SPOT price is taken from Goldprice.org and is an average of all of the spot prices that I captured over the course of the day.
The Physical price is taken from Ebay.com and is also an average of all of the prices I recorded during the course of the day.
