Posted by Gregory Monte.
For graphs showing the physical gold & silver premiums as well as the current physical gold/silver ratios compared to spot, please go to my website: http://www.didthesystemcollapse.org
Before you get too far into this post, let me just say outright that I don’t know the answer to this question. I merely raise it because I noted the breakout when it began in one of my daily updates.
Here is what I wrote on 1/12/21:
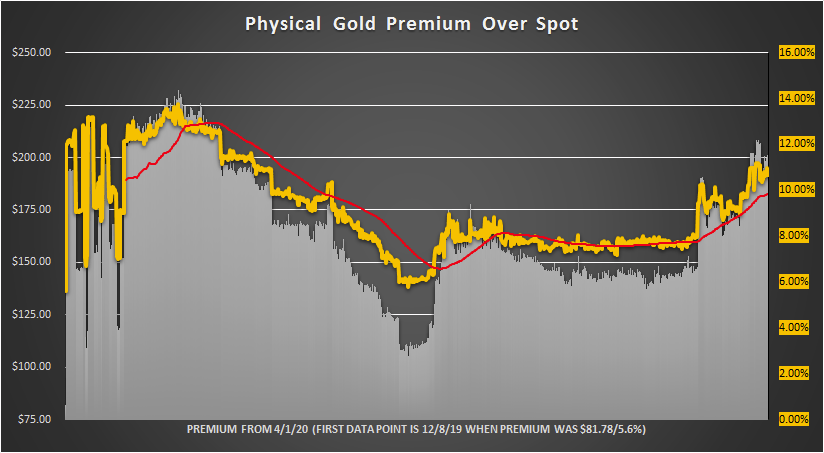
Something may be up. The physical gold premium spiked above 9% on the morning of 1/12/21 and then by evening it had broken through 10%.
This spike was all the more noteworthy because the physical gold premium had been mired in the 7-8% range since 8/20/20.
Did it have something to do with the recognition that Biden would actually be the new president? It is possible, but there might be something else going on under the surface. Time will tell, but we are far away from the premiums seen at the start of the Coronavirus scare. Back then the premium hit 14%.
The premium now stands at 10.69%.
Also, notice that the Shanghai premium to Spot first went positive on 1/11/21 – right about the same time that the physical premium jumped:

The 30-day moving average (red) shows that the Shanghai discount to Spot has been getting smaller since I started keeping records. The discount hit a low on 8/11/20 of -6.62%. However, since 1/11/21 the Shanghai price has been at almost a continuous premium to Spot.
